 MacroEnergy
Diesel is breaking records and gas is spiking too — so who actually switches this winter?
by James Bowers Published 31 August 2026
A war-driven closure of the Strait of Hormuz has pushed both diesel and natural gas prices to multi-year extremes at once. That’s an unusual setup for fuel switching, and it means the answer splits sharply by geography: strong incentive to shift toward gas in the United States, and something closer to the opposite in Europe and Asia.
Every winter, some slice of industry that can burn either diesel-range fuel or natural gas watches the price spread between the two and dispatches accordingly. Power plants with dual-fuel turbines, industrial boilers, marine engines and backup generators all have this flexibility built in, and normally the direction of the switch is easy to predict from the price ratio alone. This winter is not normal. The same geopolitical shock — the closure of the Strait of Hormuz since early March 2026 — has driven up the price of both fuels simultaneously, but through different channels and by very different amounts depending on where you’re standing. The result is a genuine divergence: American industry has one of the widest diesel-over-gas cost gaps in years and real reason to lean on gas; European and Asian buyers, who import both their gas and much of their diesel, are staring at a much flatter spread and, in places, one that still favors burning oil over gas — a faint echo of 2022.
| −95% | $5.62 | ~$3.0 | €65+ |
| Drop in Strait of Hormuz vessel traffic since the closure began, March 2026 | U.S. average diesel price per gallon, 25 Aug 2026 — 20¢ off the 2022 record | Henry Hub natural gas, $/MMBtu, late Aug 2026 — near normal | European TTF gas, €/MWh, up over 130% year to date |
Why both fuels are expensive at once
The proximate cause of this winter’s fuel-market stress traces back to a single event. After the United States and Israel struck Iranian targets on 28 February 2026, Iran’s Revolutionary Guard announced the closure of the Strait of Hormuz on 2 March; daily vessel transits fell from more than 100 to roughly five, a decline of about 95% that has persisted into late August. Crude flows out of the Gulf dropped by close to half, and the strait normally carries a fifth of the world’s seaborne LNG and nearly a third of seaborne LPG, so the shock hit oil and gas shipping together. Oil prices spiked above $130 a barrel in April before settling back to a level still roughly 20% above pre-war norms.
From that single chokepoint, the two fuel markets diverged for structural reasons that have little to do with the war itself. Diesel’s problem is a refining bottleneck layered on top of the shipping disruption: Russia, historically the world’s second-largest diesel exporter, has extended its own export ban through the fall while Ukrainian drone strikes keep knocking out Russian refining capacity, and unrelated outages at refineries in Iran and at Saudi Arabia’s large Jazan complex have cut global processing capacity further. Persian Gulf diesel exports are down roughly 80% year over year and global inventories have fallen below their five-year minimum, so the diesel crack spread — the margin refiners earn turning crude into diesel — hit an all-time high near $102 a barrel in August, about five times a normal level. Marathon Petroleum’s refining margin nearly doubled to $36.33 a barrel in the second quarter; Valero’s and Phillips 66’s did much the same.
Gas’s problem is almost entirely separate. Europe went into the summer with storage at its lowest level for the date in the historical record (about 57% full on 1 August), then a run of record heat and drought cut hydro and nuclear output just as air conditioning demand peaked, forcing gas plants to burn down storage that was meant for winter. Norwegian field outages and constrained LNG cargo availability — itself partly a function of the same Hormuz-adjacent shipping disruption, since roughly a fifth of global seaborne LNG normally transits the strait — added to the squeeze. Dutch TTF, the European gas benchmark, traded above €65/MWh in August, its highest since March and more than double where it started the year; Oxford Economics expects it to average around €60/MWh through the fourth quarter of 2026 and first quarter of 2027. In the United States, by contrast, Henry Hub gas is priced off a domestic, pipeline-connected market that barely touches the Strait of Hormuz at all, and it has stayed close to $3/MMBtu — roughly where it usually sits.
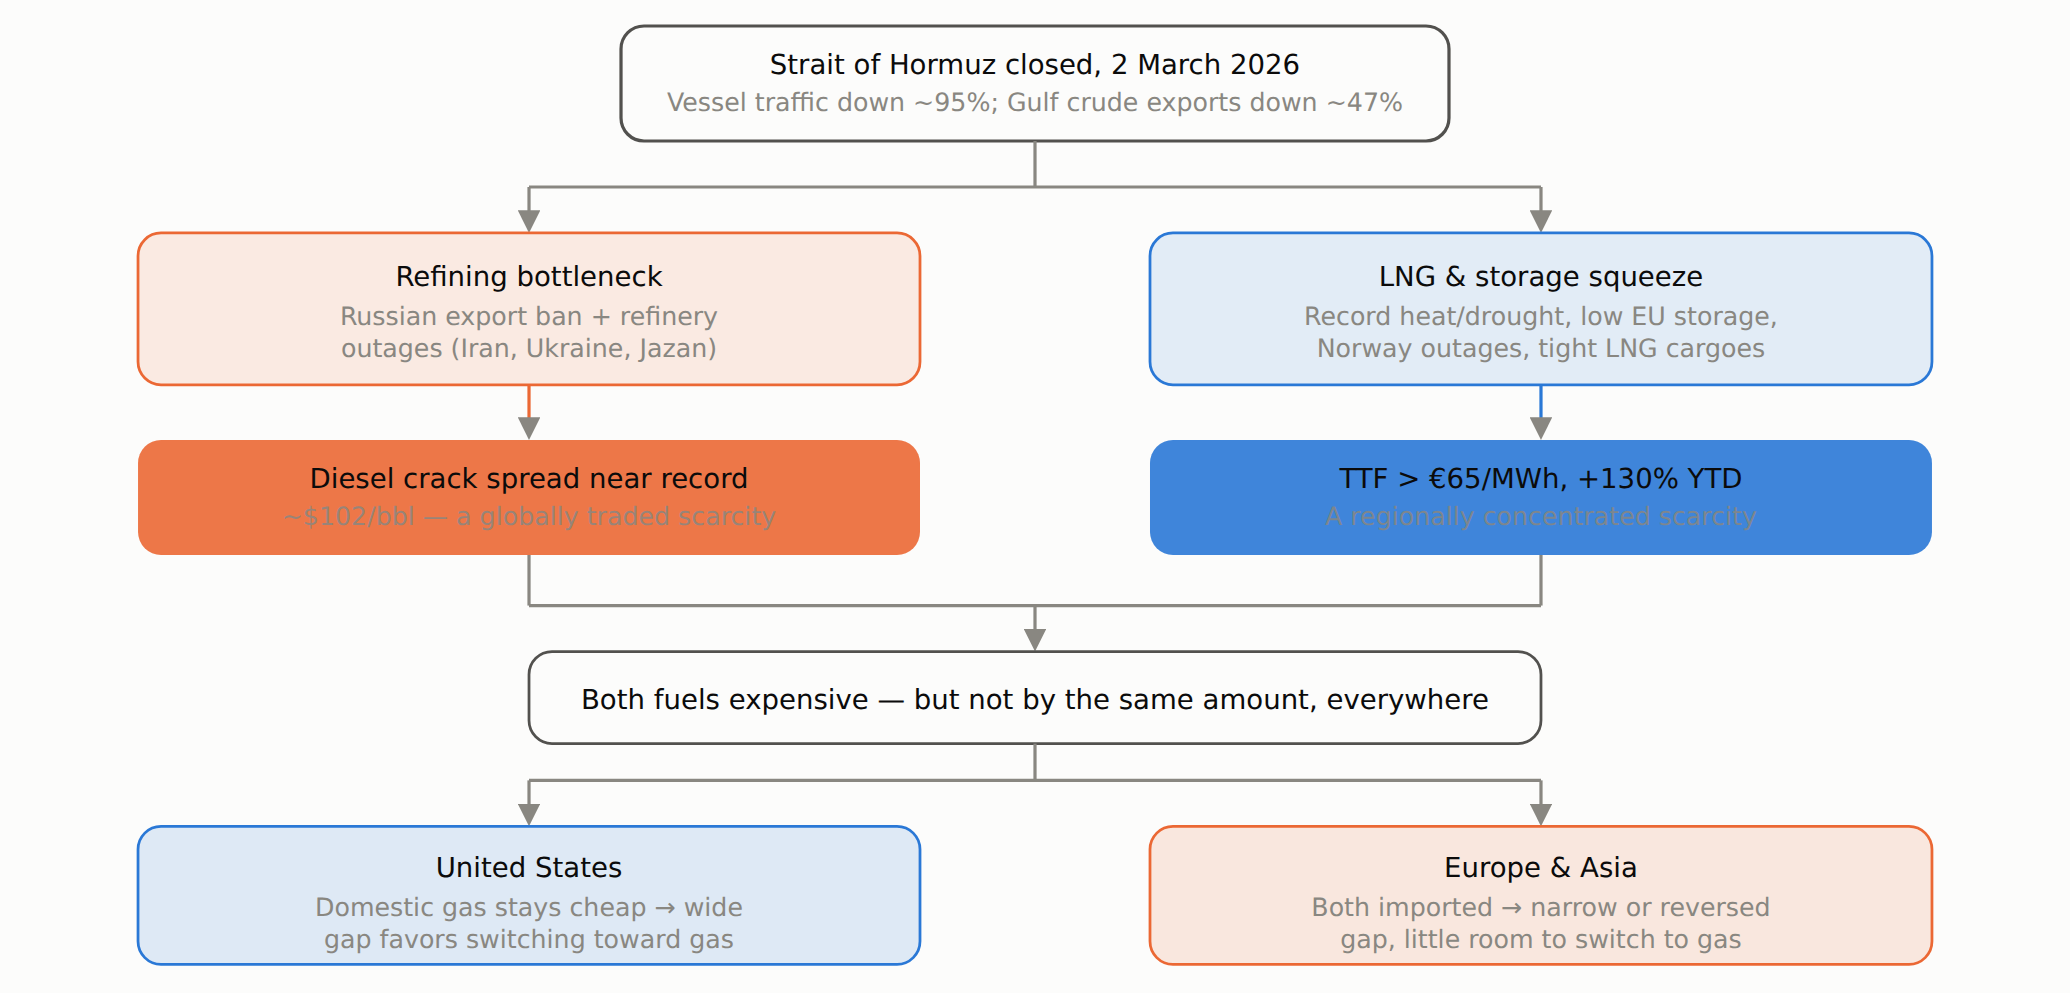
Fig. 1 — The Hormuz shock reaches diesel and gas through different channels, so the switching incentive it creates is not the same everywhere.
The price gap, region by region
Put the two fuels on the same footing — dollars per million British thermal units — and the regional split becomes concrete. In the United States, retail diesel at $5.62/gallon implies a wholesale, energy-equivalent cost on the order of $30–33/MMBtu once typical taxes and distribution margins are stripped out, against Henry Hub gas at roughly $3/MMBtu. That’s a gap of somewhere around ten to one. Historically, when gas has traded cheap relative to oil, the ratio has more commonly sat in the five-or-six-to-one range — itself the ratio that made oil-burning attractive during the 2022 crisis, just with the fuels reversed. A ten-to-one gap in gas’s favor is unusually wide, and it sits squarely on top of roughly 138 gigawatts of U.S. generating capacity — about 13% of the fleet, concentrated in Florida and the New York and New England grids — that is physically able to burn either fuel.
Europe looks nothing like that. Converting ICE low-sulphur gasoil futures (around $683/tonne in late August) to the same energy basis puts European diesel-range fuel at roughly $16/MMBtu, while TTF gas at €65/MWh converts, at the prevailing euro-dollar rate, to around $22/MMBtu. On energy content, European gas is currently the more expensive fuel — by something like 35–40% — not the cheaper one. That is a genuinely counterintuitive result if you start from the assumption that “diesel is expensive, so everyone switches to gas,” and it is the single most important qualifier on the question this article opened with.
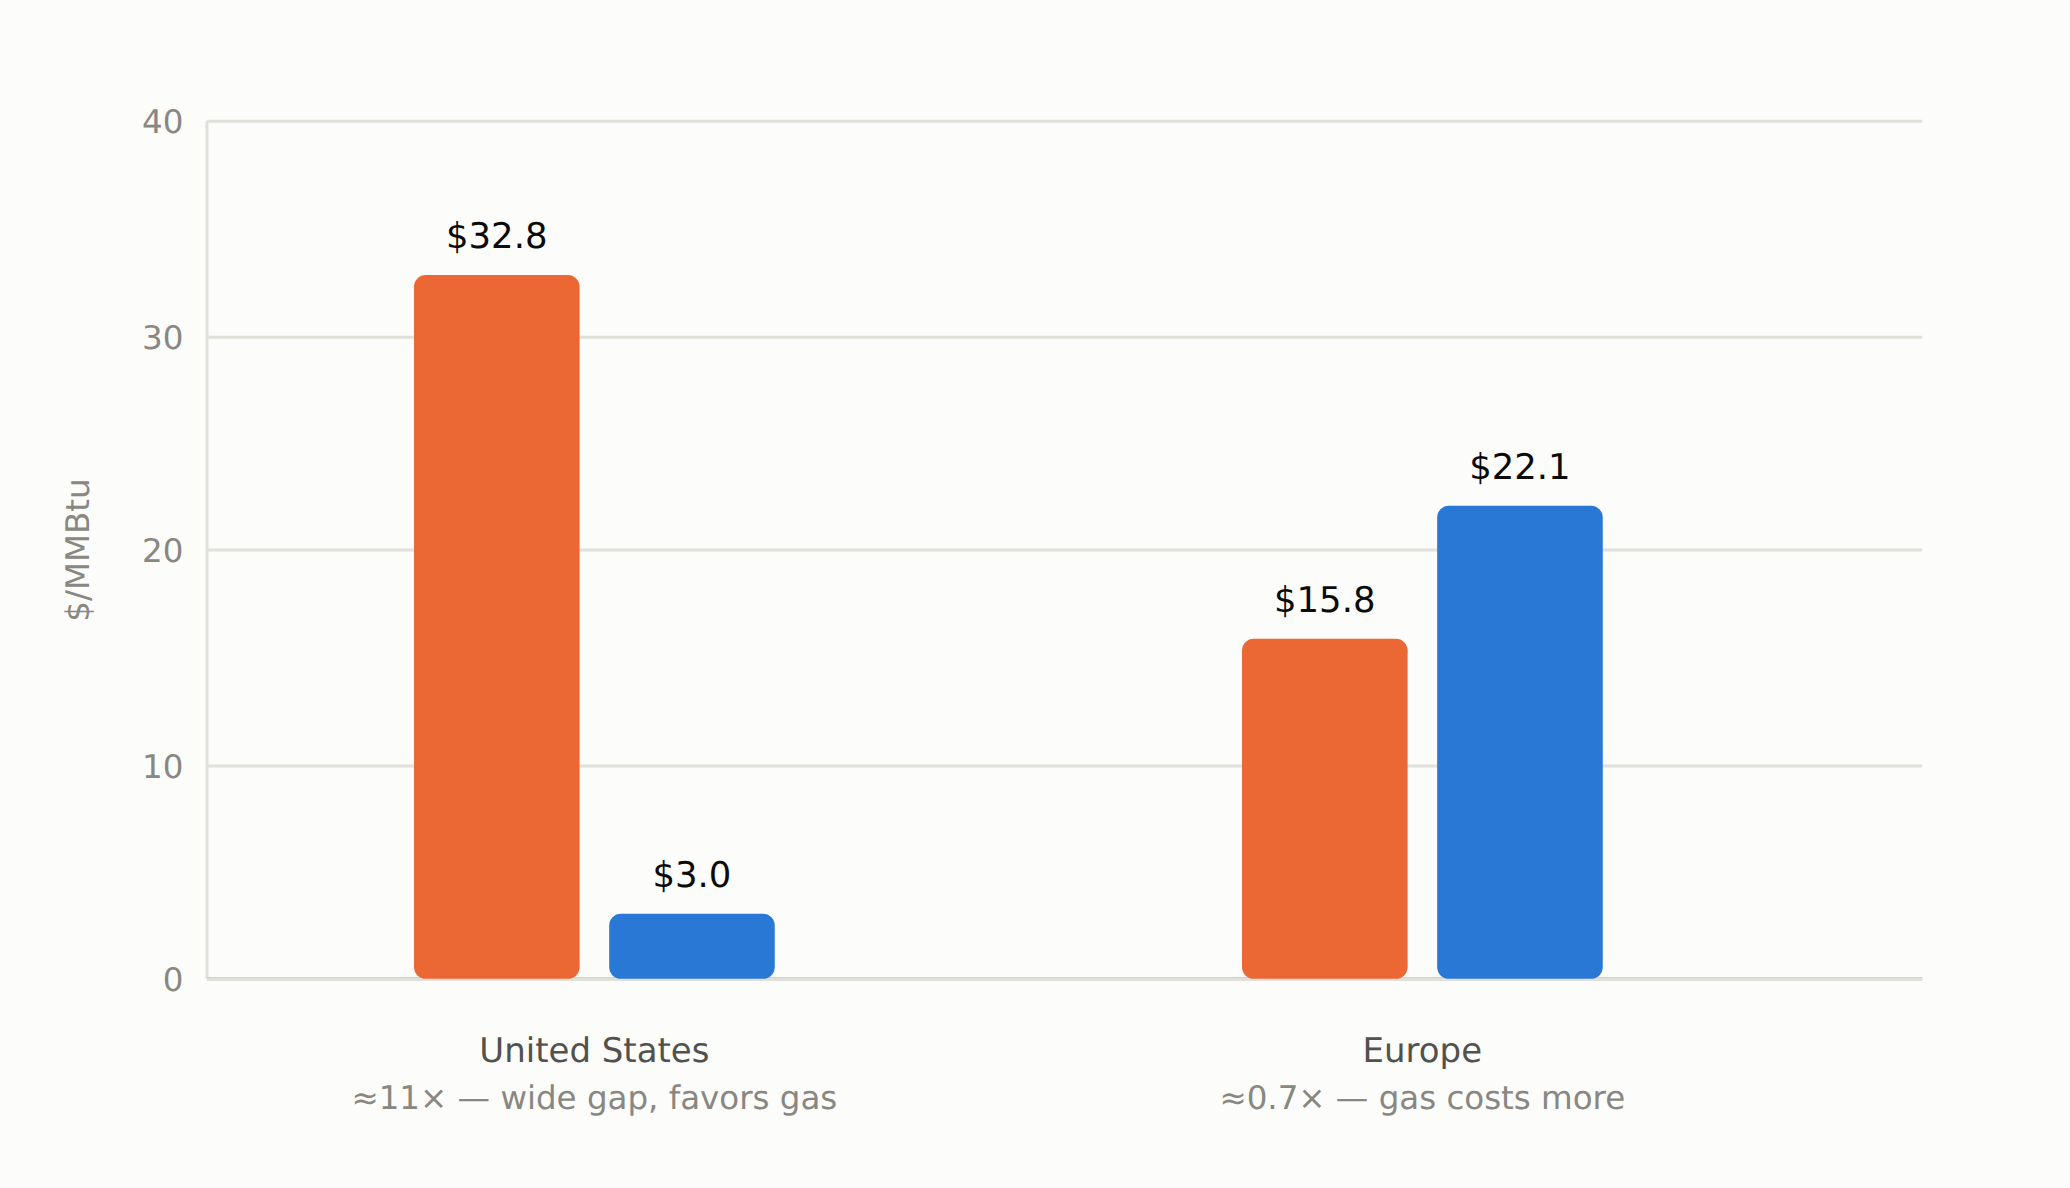
Fig. 2 — Energy-equivalent fuel costs, late August 2026. U.S. figures are derived from retail diesel and Henry Hub spot prices net of estimated taxes and distribution margin; European figures convert ICE low-sulphur gasoil and Dutch TTF futures at prevailing exchange rates. Treat as directional, not exact — both series move daily.
Who can actually switch, and which way
Fuel switching only happens where the physical capability already exists — a boiler, engine or turbine has to be built to burn more than one fuel, or convertible at reasonable cost, before any price signal matters. That capability is concentrated in a handful of sectors, and this winter it is pulling in different directions depending on the sector and the region.
| Sector | Switching capability | Direction this winter | Concrete example |
|---|---|---|---|
| Power generation | ~138 GW of U.S. capacity (13% of the fleet) can burn gas or oil; concentrated in Florida (27 GW) and the New York and New England grids, including New York’s 2.3 GW Ravenswood plant. | Toward gas | Grid operators have every incentive to avoid dispatching oil-fired backup this year; the risk is less about active switching and more about what happens on the coldest days, when gas can be physically unavailable at any price and oil gets burned anyway. |
| Data centers & backup power | Structural, multi-year shift away from diesel gensets toward gas engines and turbines, driven as much by emissions permitting as by fuel cost. | Toward gas | Caterpillar’s 2 GW natural-gas generator order for the Monarch Compute Campus in West Virginia; Wärtsilä installing 300 MW of gas engines in Ohio; Oracle/OpenAI’s Stargate site in Texas running GE Vernova and Solar Turbines gas units. |
| Marine shipping | A growing fleet of LNG dual-fuel vessels can bunker either LNG or marine gasoil (MGO), with the choice made port by port. | Hub-dependent | In Rotterdam, LNG bunker fuel priced below MGO in August ($1,209 vs. $1,271/tonne); in Singapore, LNG priced above it ($1,340 vs. $1,240/tonne) — the same global shock, opposite local outcomes. |
| Industrial heat & boilers | Many European and U.S. industrial boilers retain dual-fuel burners installed or retrofitted after the 2022 crisis specifically for this kind of switching. | Mixed, price-sensitive | The same capability that let European industry switch about 7 bcm of demand from gas to oil in 2022 could, in principle, run in reverse in the U.S. this year — but Kpler expects Northwest European industrial gas demand to keep recovering on the assumption of softer prices that, as of August, has not fully materialized. |
| Residential heating | Converting an oil furnace to gas is a capital project (typically several thousand dollars and a new gas line), not a seasonal decision. | Slow-moving | In the U.S. Northeast, state electrification programs (Mass Save, Energize CT) are pulling oil-heated homes toward heat pumps rather than gas; EIA’s formal 2026–27 Winter Fuels Outlook, due in October, will be the number to watch. |
| Road transport & agriculture | Essentially none at fleet scale — trucks and farm equipment are diesel by design, and CNG/LNG truck fleets remain a small niche. | Locked into diesel | U.S. truckers are absorbing the increase directly: an estimated $3,104 in extra monthly fuel cost per truck versus a year ago, with no practical switching option this winter. |
The precedent: this has happened before, just in reverse
Fuel switching between oil and gas is not a new phenomenon; what’s unusual this winter is the direction and the fact that both sides of the trade are expensive at once. Four earlier episodes are worth holding up against 2026.
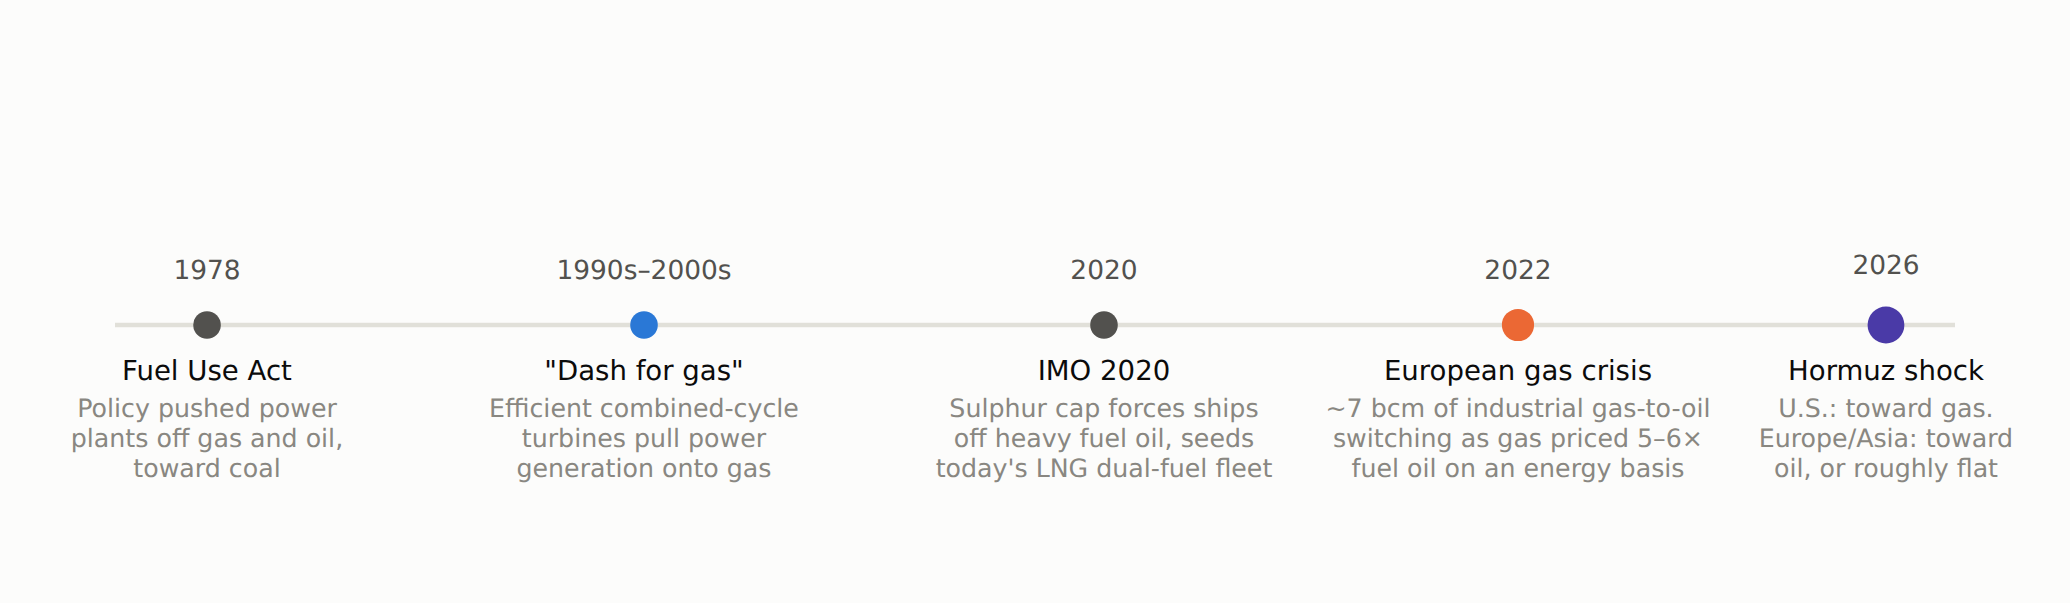
Fig. 3 — Fuel switching has run in both directions before; 2026 is unusual mainly for splitting by region rather than moving one way globally.
The closest analogue is 2022. When Russia cut pipeline flows to Europe after invading Ukraine, gas prices spiked to five or six times the energy-equivalent cost of fuel oil, and the IEA estimates that around 7 billion cubic metres of industrial gas demand — about a quarter of the total drop in industrial gas use that year — shifted to oil-fired alternatives. S&P Global tracked global gas-to-oil switching demand rising from roughly 350,000 barrels a day in the third quarter of 2022 toward a projected 630,000 b/d by early 2023. That is essentially today’s story with the fuels swapped: back then, gas was the expensive one and oil absorbed the switching; this year, in the United States at least, diesel is the expensive one and gas absorbs it. Europe’s current oil-fired generating fleet is also considerably smaller than it was in 2022, after several years of retirements, which limits how much gas-to-oil switching capacity is even left to use if that pattern were to repeat.
Further back, the 1978 Powerplant and Industrial Fuel Use Act is a reminder that switching can be forced by policy rather than price: passed after the 1973–74 oil shock, it restricted new power plants from burning natural gas or oil at all and pushed utilities toward coal, on the theory that gas supplies were too scarce to rely on — a judgment Congress reversed within a decade as gas markets loosened. The “dash for gas” of the 1990s and 2000s moved the other way, as combined-cycle gas turbines made gas the default choice for new power capacity on cost and efficiency grounds. And the International Maritime Organization’s 2020 global sulphur cap forced shipping off cheap high-sulphur fuel oil, which is what seeded the current generation of LNG dual-fuel vessels now weighing bunker choices in Rotterdam and Singapore.
Where this goes over the winter
The clearest forward-looking signal is the calendar itself: diesel’s problem is a refining and shipping bottleneck that can ease relatively quickly if the Strait of Hormuz reopens or Russian exports resume, while Europe’s gas problem is a storage deficit that can only be closed by a full injection season — realistically not before next summer. That asymmetry suggests the U.S. diesel-over-gas gap, unusual as it already is, could stay wide or even widen a little further before diesel-side supply catches up, while Europe’s gas-over-diesel premium is more likely to persist deep into 2027 regardless of what happens at Hormuz. The U.S. Energy Information Administration’s formal Winter Fuels Outlook, due in October 2026, and the European price data through the (northern) winter injection season are the two concrete checkpoints worth watching.
The most likely path in the United States is continued, quiet fuel switching wherever the physical capability already exists — industrial boilers running harder on gas, data-center buildout defaulting to gas engines rather than diesel gensets, and grid operators minimizing oil dispatch from their fuel-switching fleet even on cold days, which raises the odds of tight regional gas pricing in New York and New England on the very coldest days rather than a clean diesel-to-gas substitution. In Europe and Asia, the more interesting risk running into winter is not a diesel-to-gas story at all: it’s whether a genuine cold snap on top of low storage reproduces a scaled-down version of 2022’s gas-to-oil switching, constrained this time by how little oil-fired capacity remains on the grid. Shipping sits in between, with LNG bunkering likely to keep gaining share gradually wherever it holds even a small cost edge, reinforced by emissions rules like the EU’s FuelEU Maritime program that reward it independent of the raw price gap.
None of this is a forecast that either fuel gets meaningfully cheaper soon. It’s a forecast about direction and geography: this winter’s fuel switching, where it happens at all, is not one global story but at least two regional ones running in different directions from the same root cause.